 Michael Whitman · trading since 2017
Money and markets, explained with real numbers.
The stories behind my videos, free calculators that show their working, and plain-English guides to trading terms, each with what it looks like when it fails.
Latest explained
See all- ExplainedWhy Inflation Hit 3.7% and What Warsh's Fed Said, ExplainedUS inflation rose to 3.7% in September 2026 from 3.4%. Where the rise came from in BLS data, what the Fed under Kevin Warsh has said, and what it means for savers.
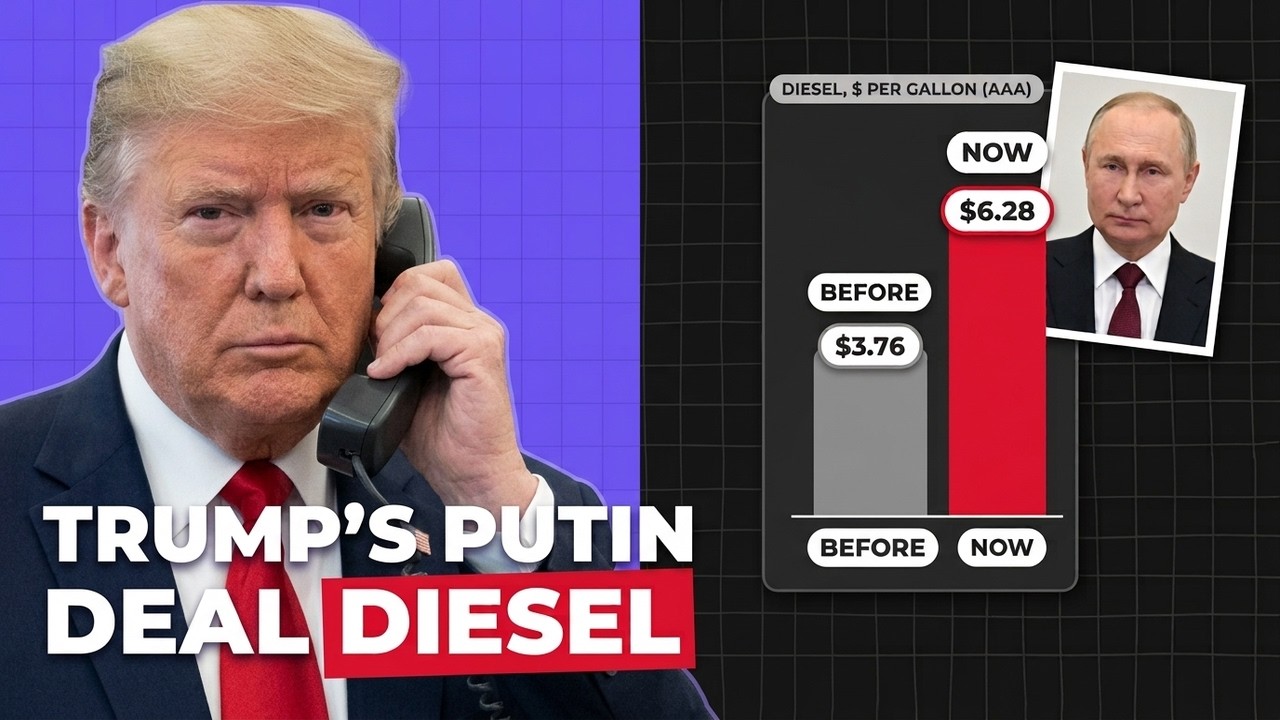
- ExplainedTrump's Diesel Deal With Putin, ExplainedTrump says Russia will send up to 4.8 million tons of diesel, and the Treasury allowed it until April 2027. What that fuel covers and what diesel costs now.
- ExplainedChina's Push to Tax the Rich, ExplainedChina now taxes offshore trusts at 20% and has a 45% top rate. What its tax data and IRS data show about who pays income tax in China and the US.
- ExplainedOpenAI's $20 Billion Revenue Gap, ExplainedOpenAI told investors its annualized revenue neared $50 billion, not the $68-70 billion reported in September. Why the figures differ and how AI stocks moved.
Free money calculators
All calculators- CalculatorIf You Invested $1,000 in Nvidia 10 Years Ago$1,000 in Nvidia on 12 Oct 2016 was worth $136,276 on 12 Oct 2026, against $3,641 in the S&P 500. On the way it fell 66.4%.
- CalculatorIf You Invested $1,000 in Bitcoin 10 Years Ago$1,000 in bitcoin on 12 Oct 2016 was worth $128,519 on 12 Oct 2026. Over 5 years it became $1,459, less than in the S&P 500, and over 1 year it lost 29%.
- CalculatorDebt Snowball vs Avalanche CalculatorRace three debts month by month, snowball against avalanche. Across 7,200 mixes of three debts the avalanche saved a median $149 and the snowball never cost less.
- CalculatorRetirement Number CalculatorAnnual spending divided by a withdrawal rate, and the years that gap takes to close. The rate is an assumption, and it is the assumption everything rests on.
Featured
 Start hereStart Here: New to Trading?Four pages to read first, in order, then six subject paths. Each page assumes the one before it, so nothing is skipped.
 Day or swing tradingDay Trading vs Swing TradingDay trading vs swing trading on SPY, 1996-2026: the median overnight gap was 0.29%, but 130 opens landed a full ATR below the prior close, past any stop.
 Free toolsTrading Calculators39 calculators. No sign-up; put in your own numbers.
New to this? Read these four, in order
Start here Step 1How to Read a CandlestickWhat a single bar on the chart is actually telling you.
 Step 2What Is Support and Resistance?The prices the market has stopped at before.
 Step 3What Is Market Structure?How those prices join up into a trend, and where it ends.
 Step 4What Is Risk Management in Trading?What a trade can cost you, decided before you take it.
Or pick a subject and read it in order
See all Reading pathSmart Money Concepts: Where to Start11 pages, in order.
 Reading pathTechnical Indicators: Where to Start11 pages, in order.
 Reading pathRisk Management: Where to Start12 pages, in order.
 Reading pathInvesting Basics: Where to Start12 pages, in order.
 Reading pathRetirement Accounts: Where to Start12 pages, in order.
 Reading pathCrypto: Where to Start12 pages, in order.
Indicators
See allWhat each one calculates, and the market condition it stops working in.
 Moving averagesWhat Is a Moving Average?A moving average is the average closing price over the last N bars, redrawn every bar. Its slope shows the trend; its position acts as a moving level.
 IndicatorsWhat Is RSI (Relative Strength Index)?RSI scores recent up moves against down moves from 0 to 100. On SPY since 1994, RSI(14) crossing 70 or 30 was followed by results within chance of an ordinary day.
 IndicatorsWhat Is MACD?MACD is the distance between two exponential moving averages, drawn as a line with a signal line and a histogram. A trend tool that behaves badly in a range.
 IndicatorsWhat Is VWAP?VWAP is the average price weighted by volume, restarted each session. It is the only common chart line whose input is not price alone: the reason to use it.
 IndicatorsWhat Are Bollinger Bands?Bollinger Bands are a 20-bar average with a channel two standard deviations wide around it. They measure volatility; a band touch is not a signal to fade.
 IndicatorsWhat Is the Stochastic Oscillator?The stochastic measures where the close sat in the recent high-low range. Overbought means closing near the top of it, which is what an uptrend looks like.
 Moving averagesExponential Moving Average: Not FasterAn exponential moving average lets weight decay instead of stopping. It reacts sooner to new bars, yet its center of mass matches the simple average: 9.5 bars.
 IndicatorsWhat Is ATR (Average True Range)?ATR measures how big a bar has been, in price. It has no direction in it — it rose during the selloff on the chart below — and its real job is sizing stops.
Smart money concepts
See allThe vocabulary, and which parts of it are renamed support and resistance.
- Smart moneyWhat Are Smart Money Concepts (SMC)?Smart money concepts is five ideas: structure, liquidity, order blocks, fair value gaps, premium and discount. Which parts are genuinely new.
 Smart moneyWhat Is an Order Block?An order block is the last opposing candle before a move that breaks market structure, marking where large orders entered the market.
 Smart moneyWhat Is Liquidity in Trading?Liquidity is the resting orders at prices where everyone can see they should be. It explains why price so often runs to an obvious level and turns at once.
 Smart moneyWhat Is a Fair Value Gap?A fair value gap is a three-candle pattern where the first and third candles do not overlap, leaving a band of prices that only one fast candle passed through.
Reading the chart itself
See allThe approach that uses no indicators, and the one input that is not made from price.
 Price actionWhat Is Price Action Trading?Price action means reading the bars themselves — size, speed and shape — rather than indicators calculated from them. Here is what that gives you.
 Order flowWhat Is Volume in Trading?Volume is how many shares or contracts changed hands in a period. It is the one chart number not derived from price, which makes it worth looking at.
 Price actionWhat Is Technical Analysis?Technical analysis is reading price and volume rather than a company or an economy. What it assumes, and the honest answer to whether it works.
 Price actionWhat Are Chart Patterns?A chart pattern is a named shape in price: a double top, a flag, a triangle. Underneath every one is a level, and the level is what actually does the work.
Tutorials to start with
All videos on YouTube-
 Video · YouTubeFull Smart Money Concepts Course, Step by StepSmart money concepts, start to finish.
-
 Video · YouTubeHow to Add Moving Averages on TradingViewAdding and setting them up, step by step.
-
 Video · YouTubeBollinger Bands Strategy for BeginnersSettings and a step-by-step walkthrough.
-
 Video · YouTubeMarket Structure for Beginners (Full Course)Trends, highs and lows, and where a trend ends.
Browse the site
- 746 pagesTrading GlossaryWhat each term means, a worked example, and when the idea stops working.
 157 pagesHow-To GuidesNumbered steps, what you need first, and how to tell it worked.
 53 pagesInvestingFunds, accounts, what they cost to hold, and the arithmetic.
 39 pagesTrading CalculatorsCalculators that show their working.
 328 pagesComparisonsTwo things side by side, and which one wins when.
- Beginner pathStart Here: New to Trading?Four pages to read first, then six subjects in order.
Who writes this
I started learning to trade in 2017 and went full time in 2020. Before that I was a marketing manager, which mostly means I am used to reading numbers and reporting what they say rather than what somebody hoped they said.
Nearly every page here has a section on what the idea looks like when it fails, because that is the part I could not find anywhere when I needed it.
More about me · How this site is made
Educational, not financial advice. Test every idea on your own charts before risking money.