Buy-Side vs Sell-Side Liquidity: Where Each Side Rests

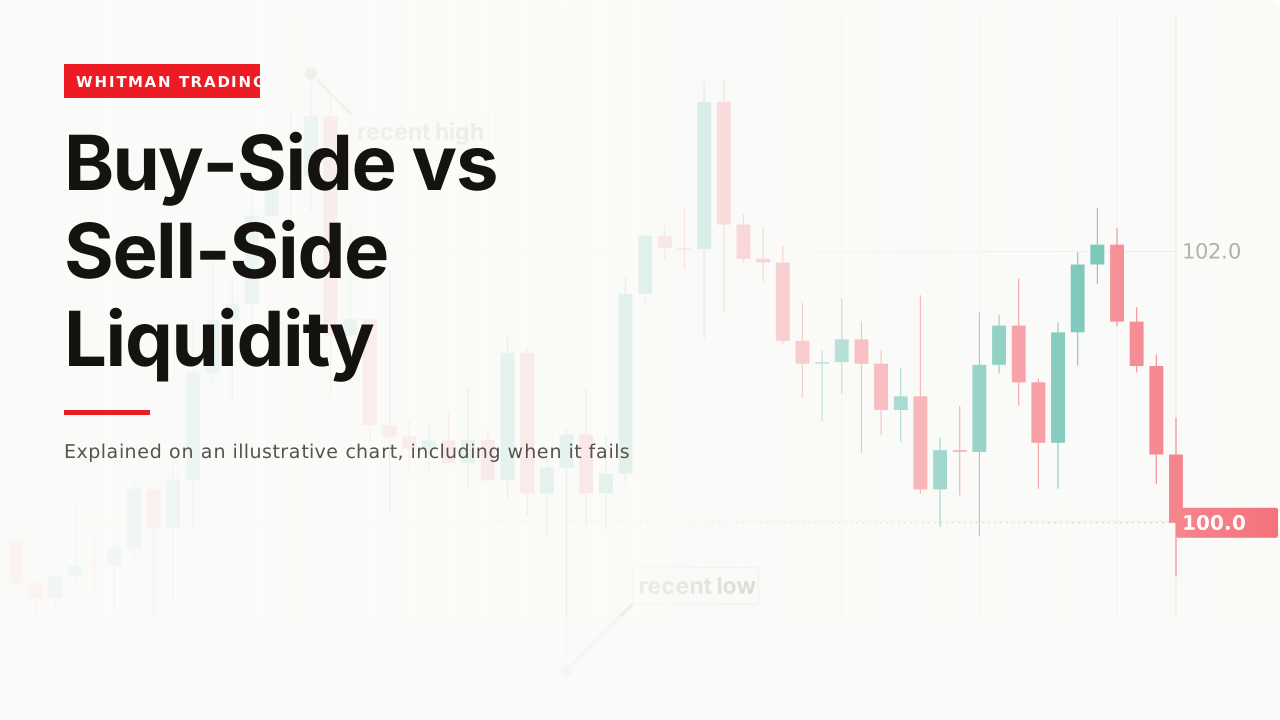
Buy-side liquidity is the cluster of buy orders likely resting above an obvious high, mostly short sellers' stop-losses and breakout traders' buy stops. Sell-side liquidity is the mirror image: sell orders resting below an obvious low. ICT treats both as places price is likely to reach before it turns.
Covered on this page: TradingView and LuxAlgo.
Every obvious high and low on a chart has orders parked just beyond it. Buy-side and sell-side liquidity are ICT’s names for those two groups, and the names are more literal than they sound.
How it works
Buy-side liquidity rests above a high. Two kinds of order sit there. Traders who sold short below the high put their stop-losses above it, and a stop on a short position is a buy order.
Breakout traders add to it. Traders waiting for a breakout put buy-stop entry orders just above the same high. When price trades through, both turn into market buy orders at once.
Sell-side liquidity rests below a low. It is the mirror. Traders who bought above the low keep their stop-losses under it, which are sell orders, and breakdown traders park sell-stop entries in the same place.
So the name describes the orders, not the direction. Buy-side liquidity is above price and consists of buy orders. Sell-side liquidity is below price and consists of sell orders.

Why price is expected to reach them
A large order needs a counterparty. A fund that wants to sell a big position needs a lot of buyers at once, and the moment a crowded high is taken is the moment a wave of buy stops triggers.
That is where ICT expects tops. In ICT’s reading, that is why a run above an obvious high is often where a top forms, and why the phrase you will hear is selling into buy-side liquidity.
The same logic runs the other way at lows. A large buyer finds its sellers when the sell stops under an obvious low go off.
ICT calls the level price is heading for the draw on liquidity. Before a trade, the question is which side is more likely to be reached next. The ICT page covers that vocabulary.
Where the stops sit is inferred, never seen. Stop orders are held by brokers until triggered, so no retail feed shows them. The liquidity pool page goes further into why every map of resting orders is an educated guess.
Equal highs and equal lows
Two highs at the same price are the textbook buy-side marker. Two separate groups of traders put stops above one number at different times, so the cluster is thicker than above a single high. ICT material often calls these relatively equal highs, because they rarely match to the cent.
The chart-pattern name for the same shape is a double top. The double top page treats two equal highs as a level price tends to test again, which is the same observation from the classical side. Equal lows are the double bottom.
Indicators mark them for you. The free LuxAlgo Smart Money Concepts script on TradingView labels them EQH and EQL, with a setting for how many bars must confirm each one.
The same label gets two readings. In the tutorial linked on this page, the equal highs label is described as a short-term wall rather than a target, which is the opposite reading to ICT’s. Both readings describe one level, and which one plays out is decided by what price does there.
Two meanings that get confused
On Wall Street, the buy side and the sell side are kinds of firms. The buy side is asset managers and funds that buy securities; the sell side is the brokers and investment banks that sell them research and execution. Neither has anything to do with stops above a high.
SSL is also the name of an indicator. The SSL channel is a moving-average crossover tool, and it shows up in trading titles more often than sell-side liquidity does.
A worked example
Take a hypothetical stock that has spent two weeks between $170.00 and $174.00, with two separate highs at $174.00.
Mark both sides first. Buy-side liquidity is above $174.00. Sell-side liquidity is below $170.00. Nothing about the marks says which gets taken first.
Price trades to $174.45 and closes back at $173.80. The buy-side above the equal highs has been run: the stops triggered, and price could not hold above them. In ICT terms, the run found its sellers.
The next draw is now the other side. With the highs taken, the untouched lows at $170.00 are the obvious remaining pool, $3.80 below the close.
The read has a fixed invalidation. A close back above $174.45 means the run was a breakout rather than a sweep, and the short idea is finished. The distance from a sale near $173.80 to that level is 65 cents, and that number sets the position size.

The original data
In our study of 24,971 trading videos, exactly 1 title names buy-side and sell-side liquidity outright: a Tom Crown guide at 230,488 views and 4.7 minutes long.
The idea itself is far more common than the words. 207 titles pair liquidity with sweep, grab, hunt, pool, run, raid, side, inducement, ICT or smart money. Those 207 come from 140 channels, and the median one gets 13,812 views.
The abbreviations are a trap for searchers. Of the 4 titles that use BSL or SSL, 3 are about the SSL indicator rather than sell-side liquidity.
The classical name has its own audience too: 61 titles name a double top or double bottom, with a median of 11,296 views.
When it fails
The run keeps going
The expensive case is a breakout. Price takes the buy-side above the equal highs and simply keeps rising, because the buyers who triggered were joined by more. Anyone who sold the run as a sweep is short into a trend, with the level they were leaning on already behind them.
Both sides are always available
Every range has a high and a low, so there is always buy-side above and sell-side below. Naming the draw after price has moved is not a forecast. The work is choosing the side before it happens and writing down what would prove the choice wrong.
Equal is in the eye of the drawer
Two highs a few cents apart look equal on a daily chart and different on a five-minute chart. Loose matching finds equal highs everywhere, and a level found everywhere tells you nothing.
Your own stop is part of the pool
A stop one tick above the equal highs sits in the most crowded spot on the chart. Placing it further away with a smaller position is a legitimate choice that the concept itself argues for.
Related
A liquidity pool is the general idea behind both sides, and that page explains why no feed can show where the stops really are.
A liquidity sweep is what happens when price reaches one side and reverses, and it covers how to tell that from a real break.
And the double top page is the classical view of equal highs, useful because it states when the pattern is complete.
Basically that’s just showing you that you have some equal highs. Basically, I just use it as somewhat of a level of resistance in the short term. It says, hey, we’re hitting some type of wall.
— Michael Whitman, from this video
This page is educational, not financial advice. Test every idea on your own charts before risking money. Some links on this page earn a commission if you buy through them. It costs you nothing and it does not decide what appears here or in what order — how these pages are made is set out in our methodology.